Disclaimer
The way I’m doing this relies on a feature I wrote for Graphite that was only recently merged to trunk, so at time of writing that feature isn’t in a stable release. Hopefully it’ll be in 0.9.10. Until then, you can at least test this setup using Graphite’s trunk version.
Oh yeah, the new feature is the ability to send graph images (not links) via email. I surfaced this feature in Graphite through the graph menus that pop up when you click on a graph in Graphite, but implemented it such that it’s pretty easy to call from a script (which I also wrote – you’ll see if you read the post).
Also, note that I assume you already know Nagios, how to install new command scripts, and all that. It’s really easy to figure this stuff out in Nagios, and it’s well-documented elsewhere, so I don’t cover anything here but the configuration of this new feature.
The Idea
I’m not a huge fan of Nagios, to be honest. As far as I know, nobody really is. We all just use it because it’s there, and the alternatives are either overkill, unstable, too complex, or just don’t provide much value for all the extra overhead that comes with them (whether that’s config overhead, administrative overhead, processing overhead, or whatever depends on the specific alternative you’re looking at). So… Nagios it is.
One thing that *is* pretty nice about Nagios is that configuration is really dead simple. Another thing is that you can do pretty much whatever you want with it, and write code in any language you want to get things done. We’ll take advantage of these two features to actually do a couple of things:
- Monitor a metric by polling Graphite for it directly
- Tell Nagios to fire off a script that’ll go get the graph for the problematic metric, and send email with the graph embedded in it to the configured contacts.
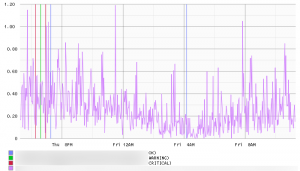
- Record that we sent the alert back in Graphite, so we can overlay those events on the corresponding metric graph and verify that alerts are going out when they should, that the outgoing alerts are hitting your phone without delay, etc.
The Candy
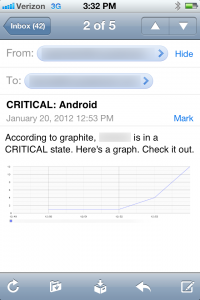
Just to be clear, we’re going to set things up so you can get alert messages from Nagios that look like this (click to enlarge):
And you’ll also be able to track those alert events in Graphite in graphs that look like this (click to enlarge, and note the vertical lines – those are the alert events.):
Defining Contacts
In production, it’s possible that the proper contacts and contact groups already exist. For testing (and maybe production) you might find that you want to limit who receives graphite graphs in email notifications. To test things out, I defined:
- A new contact template that’s configured specifically to receive the graphite graphs. Without this, no graphs.
- A new contact that uses the template
- A new contact group containing said contact.
For testing, you can create a test contact in templates.cfg:
define contact{ name graphite-contact service_notification_period 24x7 host_notification_period 24x7 service_notification_options w,u,c,r,f,s host_notification_options d,u,r,f,s service_notification_commands notify-svcgraph-by-email host_notification_commands notify-host-by-email register 0 } |
You’ll notice a few things here:
- This is not a contact, only a template.
- Any contact defined using this template will be notified of service issues with the command ‘notify-svcgraph-by-email’, which we’ll define in a moment.
In contacts.cfg, you can now define an individual contact that uses the graphite-contact template we just assembled:
define contact{ contact_name graphiteuser use graphite-contact alias Graphite User email someone@example.com } |
Of course, you’ll want to change the ’email’ attribute here, even for testing.
Once done, you also want to have a contact group set up that contains this new ‘graphiteuser’, so that you can add users to the group to expand the testing, or evolve things into production. This is also done in contacts.cfg:
define contactgroup{ contactgroup_name graphiteadmins alias Graphite Administrators members graphiteuser } |
Defining a Service
Also for testing, you can set up a test service, necessary in this case to bypass default settings that seek to not bombard contacts by sending an email for every single aberrant check. Since the end result of this test is to see an email, we want to get an email for every check where the values are in any way out of bounds. In templates.cfg put this:
define service{ name test-service use generic-service passive_checks_enabled 0 contact_groups graphiteadmins check_interval 20 retry_interval 2 notification_options w,u,c,r,f notification_interval 30 first_notification_delay 0 flap_detection_enabled 1 max_check_attempts 2 register 0 } |
Again, the key point here is to insure that no notifications are ever silenced, deferred, or delayed by nagios in any way, for any reason. You probably don’t want this in production. The other point is that when you set up an alert for a service that uses ‘test-service’ in its definition, the alerts will go to our previously defined ‘graphiteadmins’.
To make use of this service, I’ve defined a service in ‘localhost.cfg’ that will require further explanation, but first let’s just look at the definition:
define service{ use test-service host_name localhost service_description Some Important Metric _GRAPHURL "http://graphite.example.com/render?width=800&from=-1hours&until=now&target=graphite.path.to.target" check_command check_graphite_data!24!36 notifications_enabled 1 } |
There are two new things we need to understand when looking at this definition:
- What is ‘check_graphite_data’?
- What is ‘_GRAPHURL’?
These questions are answered in the following section.
In addition, you should know that the value for _GRAPHURL is intended to come straight from the Graphite dashboard. Go to your dashboard, pick a graph of a single metric, grab the URL for the graph, and paste it in (and double-quote it).
Defining the ‘check_graphite_data’ Command
This command relies on a small script written by the folks at Etsy, which can be found on github: https://github.com/etsy/nagios_tools/blob/master/check_graphite_data
Here’s the commands.cfg definition for the command:
# 'check_graphite_data' command definitiondefine command{ command_name check_graphite_data command_line $USER1$/check_graphite_data -u $_SERVICEGRAPHURL$ -w $ARG1$ -c $ARG2$ } |
The ‘command_line’ attribute calls the check_graphite_data script we got on github earlier. The ‘-u’ flag is a URL, and this is actually using the custom object attribute ‘_GRAPHURL’ from our service definition. You can see more about custom object variables here: http://nagios.sourceforge.net/docs/3_0/customobjectvars.html – the short story is that, since we defined _GRAPHURL in a service definition, it gets prepended with ‘SERVICE’, and the underscore in ‘_GRAPHURL’ moves to the front, giving you ‘$_SERVICEGRAPHURL’. More on how that works at the link provided.
The ‘-w’ and ‘-c’ flags to check_graphte_data are ‘warning’ and ‘critical’ thresholds, respectively, and they correlate to the positions of the service definition’s ‘check_command’ arguments (so, check_graphite_data!24!36 maps to ‘check_graphite_data -u <url> -w 24 -c 36’)
Defining the ‘notify-svcgraph-by-email’ Command
This command relies on a script that I wrote in Python called ‘sendgraph.py’, which also lives in github: https://gist.github.com/1902478
The script does two things:
- It emails the graph that corresponds to the metric being checked by Nagios, and
- It pings back to graphite to record the alert itself as an event, so you can define a graph for, say, ‘Apache Load’, and if you use this script to alert on that metric, you can also overlay the alert events on top of the ‘Apache Load’ graph, and vet that alerts are going out when you expect. It’s also a good test to see that you’re actually getting the alerts this script tries to send, and that they’re not being dropped or seriously delayed.
To make use of the script in nagios, lets define the command that actually sends the alert:
define command{ command_name notify-svcgraph-by-email command_line /path/to/sendgraph.py -u "$_SERVICEGRAPHURL$" -t $CONTACTEMAIL$ -n "$SERVICEDESC$" -s $SERVICESTATE$ } |
A couple of quick notes:
- Notice that you need to double-quote any variables in the ‘command_line’ that might contain spaces.
- For a definition of the command line flags, see sendgraph.py’s –help output.
- Just to close the loop, note that notify-svcgraph-by-email is the ‘service_notification_commands’ value in our initial contact template (the very first listing in this post)
Fire It Up
Fire up your Nagios daemon to take it for a spin. For testing, make sure you set the check_graphite_data thresholds to numbers that are pretty much guaranteed to trigger an alert when Graphite is polled. Hope this helps! If you have questions, first make sure you’re using Graphite’s ‘trunk’ branch, and not 0.9.9, and then give me a shout in the comments.

