I like Hudson. Sure, it’s written in Java, but let’s be honest, it kinda rocks. If you’re a Java developer, it’s admittedly worlds better because it integrates with seemingly every Java development tool out there, but we can do some cool things in Python too, and I thought I’d share a really simple setup to get coverage.py’s HTML reports and nose’s xUnit-style reports into your Hudson interface.
I’m going to assume that you know what these tools are and have them installed. I’m working with a local install of Hudson for this demo, but it’s worth noting that I’ve come to find a local install of Hudson pretty useful, and it doesn’t really eat up too much CPU (so far). More on that in another post. Let’s get moving.
Process Overview
As mentioned, this process is really pretty easy. I’m only documenting it because I haven’t seen it documented before, and someone else might find it handy. So here it is in a nutshell:
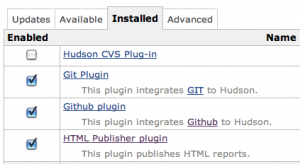
- Install the HTML Publisher plugin
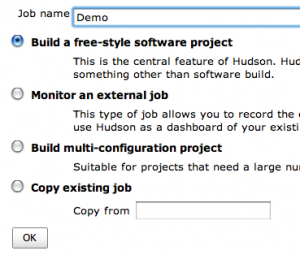
- Create or alter a configuration for a “free-style software project”
- Add a Build Step using the ‘Execute Shell’ option, and enter a ‘nosetests’ command, using its built-in support for xUnit-style test reports and coverage.py
- Check the ‘Publish HTML Report’, and enter the information required to make Hudson find the coverage.py HTML report.
- Build, and enjoy.
Install The HTMLReport Plugin
From the dashboard, click ‘Manage Hudson’, and then on ‘Manage Plugins’. Click on the ‘Available’ tab to see the plugins available for installation. It’s a huge list, so I generally just hit ‘/’ in Firefox or cmd-F in Chrome and search for ‘HTML Publisher Plugin’. Check the box, go to the bottom, and click ‘Install’. Hudson will let you know when it’s done installing, at which time you need to restart Hudson.

Configure a ‘free-style software project’
If you have an existing project already, click on it and then click the ‘Configure’ link in the left column. Otherwise, click on ‘New Job’, and choose ‘Build a free-style software project’ from the list of options. Give the job a name, and click ‘OK’.

Add a Build Step
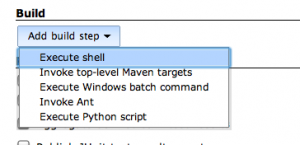
In the configuration screen for the job, which you should now be looking at, scroll down and click the button that says ‘Add build step’, and choose ‘Execute shell’ from the resulting menu.

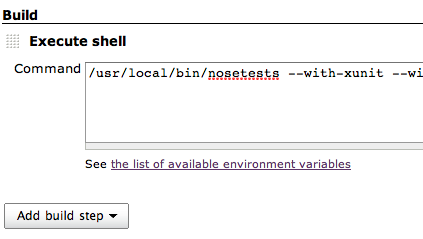
This results in a ‘Command’ textarea appearing, which is where you type the shell command to run. In that box, type this:
/usr/local/bin/nosetests --with-xunit --with-coverage --cover-package demo --cover-html -w tests
Of course, replace ‘demo’ with the name of the package you want covered in your coverage tests to avoid the mess of having coverage.py try to seek out every module used in your entire application.
We’re telling Nose to generate an xUnit-style report, which by default will be put in the current directory in a file called ‘nosetests.xml’. We’re also asking for coverage analysis using coverage.py, and requesting an HTML report of the analysis. By default, this is placed in the current directory in ‘cover/index.html’.
Now we need to set up our reports by telling Hudson we want them, and where to find them.
Enable JUnit Reports
In the ‘Post-Build Actions’ area at the bottom of the page, check ‘Publish JUnit test result report’, and make it look like this:
The ‘**’ is part of the Ant Glob Syntax, and stands for the current working directory. Remember that we said earlier nose will publish, by default, to a file called ‘nosetests.xml’ in the current working directory.
The current working directory is going to be the Hudson ‘workspace’ for that job, linked to in the ‘workspace root’ link you see in the above image. It should mostly be a checkout of your source code. Most everything happens relative to the workspace, which is why in my nosetest command you’ll notice I pass ‘-w tests’ to tell nose to look in the ‘tests’ subdirectory of the current working directory.
You could stop right here if you don’t track coverage, just note that these reports don’t get particularly exciting until you’ve run a number of builds.
Enable Coverage Reports
Just under the JUnit reporting checkbox should be the Publish HTML Reports checkbox. The ordering of things can differ depending on the plugins you have installed, but it should at least still be in the Post-build Actions section of the page.
Check the box, and a form will appear. Make it look like this:
By default, coverage.py will create a directory called ‘cover’ and put its files in there (one for each covered package, and an index). It puts them in the directory you pass to nose with the ‘-w’ flag. If you don’t use a ‘-w’ flag… I dunno — I’d guess it puts it in the directory from where you run nose, in which case the above would become ‘**/cover’ or just ‘cover’ if this option doesn’t use Ant Glob Syntax.
Go Check It Out!
Now that you have everything put together, click on ‘Save’, and run some builds!
On the main page for your job, after you’ve run a build, you should see a ‘Coverage.py Report’ link and a ‘Latest Test Result’ link. After multiple builds, you should see a test result ‘Trend’ chart on the job’s main page as well.
Almost everything on the page is clickable. The trend graph isn’t too enlightening until multiple builds have run, but I find the coverage.py reports a nice way to see at-a-glance what chunks of code need work. It’s way nicer than reading the line numbers output on the command line (though I sometimes use those too).
How ’bout you?
If you’ve found other nice tricks in working with Hudson, share! I’ve been using Hudson for a while now, but that doesn’t mean I’m doing anything super cool with it — it just means I know enough to suspect I could be doing way cooler stuff with it that I haven’t gotten around to playing with. 🙂


